Power BI
What is Power BI?
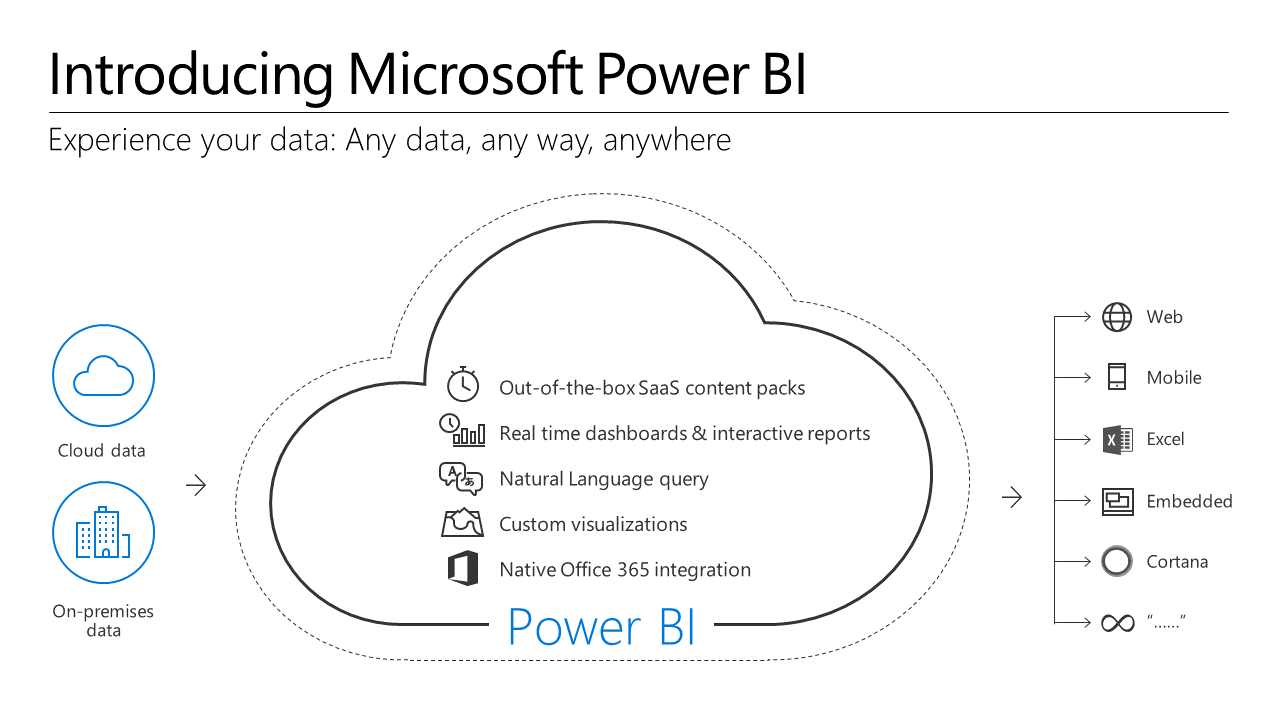
Power BI is Microsoft’s new solution to dashboarding, reporting, and multi-user accessibility. It allows you to bring data in from multiple sources, mash it up, edit it, join it, and then report it on it. After that you can share it online with your organisation, so others can build easy, drag-and-drop reports and dashboards with it.

Why Power BI?
Power BI allows us to work with data from a huge range of sources and present it back with relative ease. By using Power BI, we can work with all the different kinds of data we want to – and produce the kind of reports we want to – quickly and easily, and all in one place.
By using this single service for everything we’ll be covering, we can get on with learning what really matters, rather than getting bogged down in how to use the systems.
Getting started with Power BI
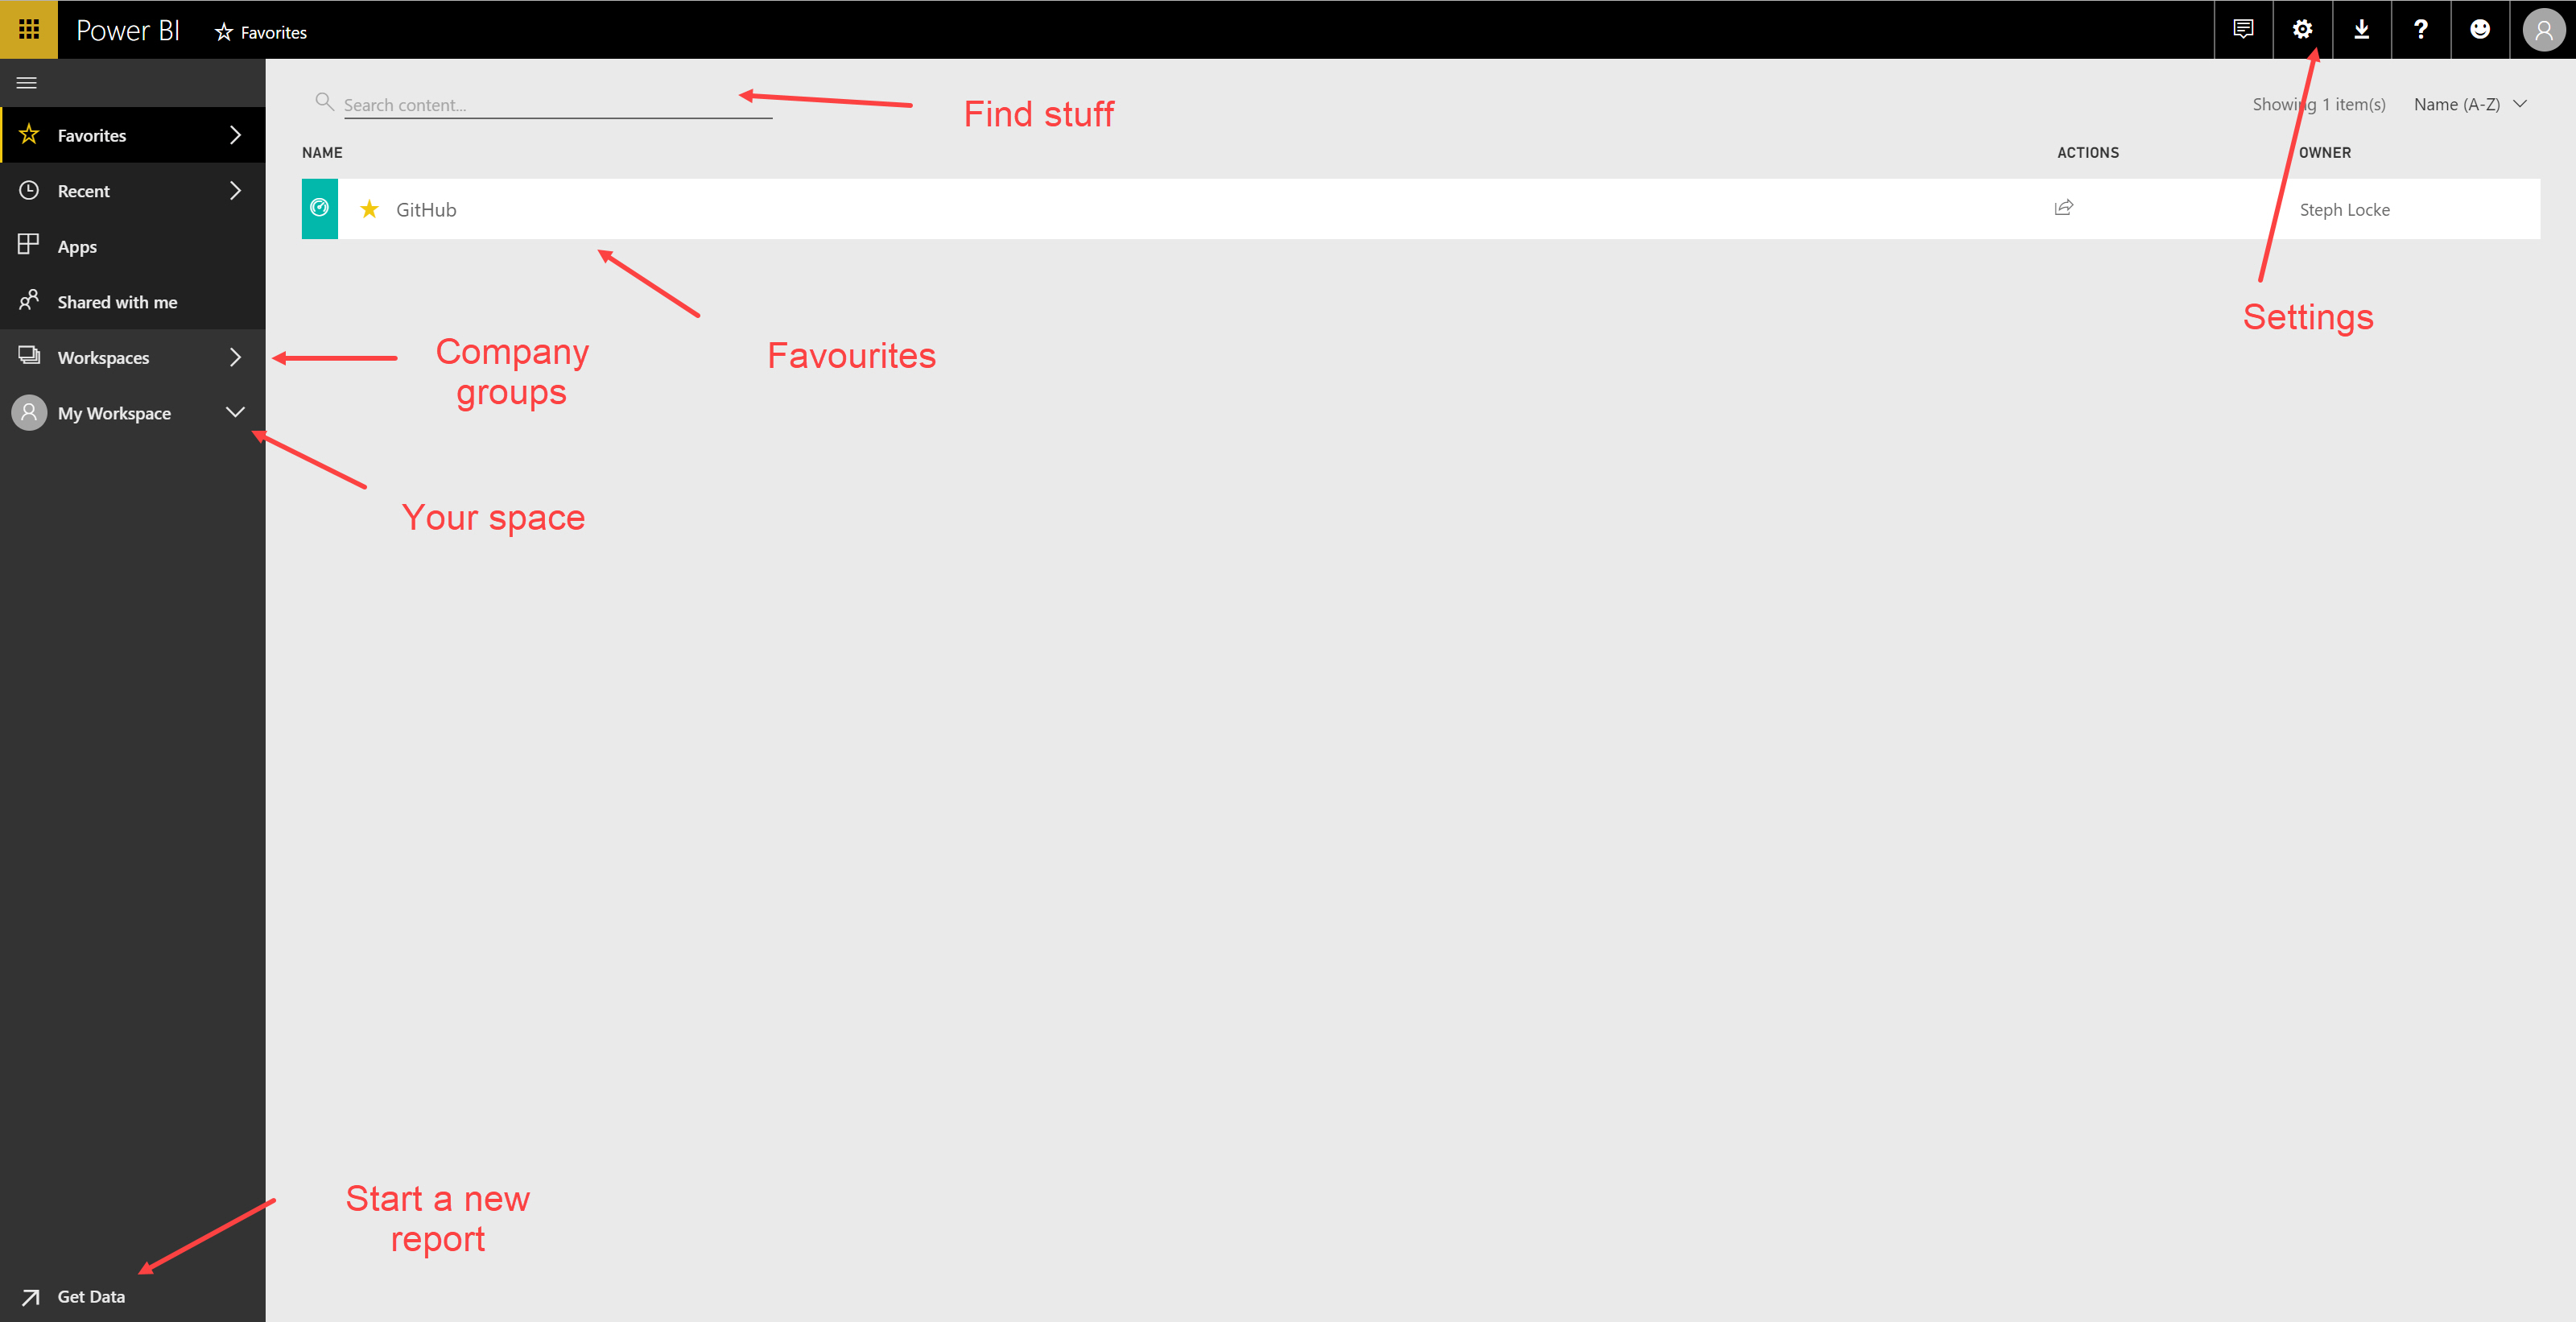
The Power BI Online website is where we’ll spend a lot of time over the next few days. This allows us to create dashboards straight away or host reports we make on our machines.
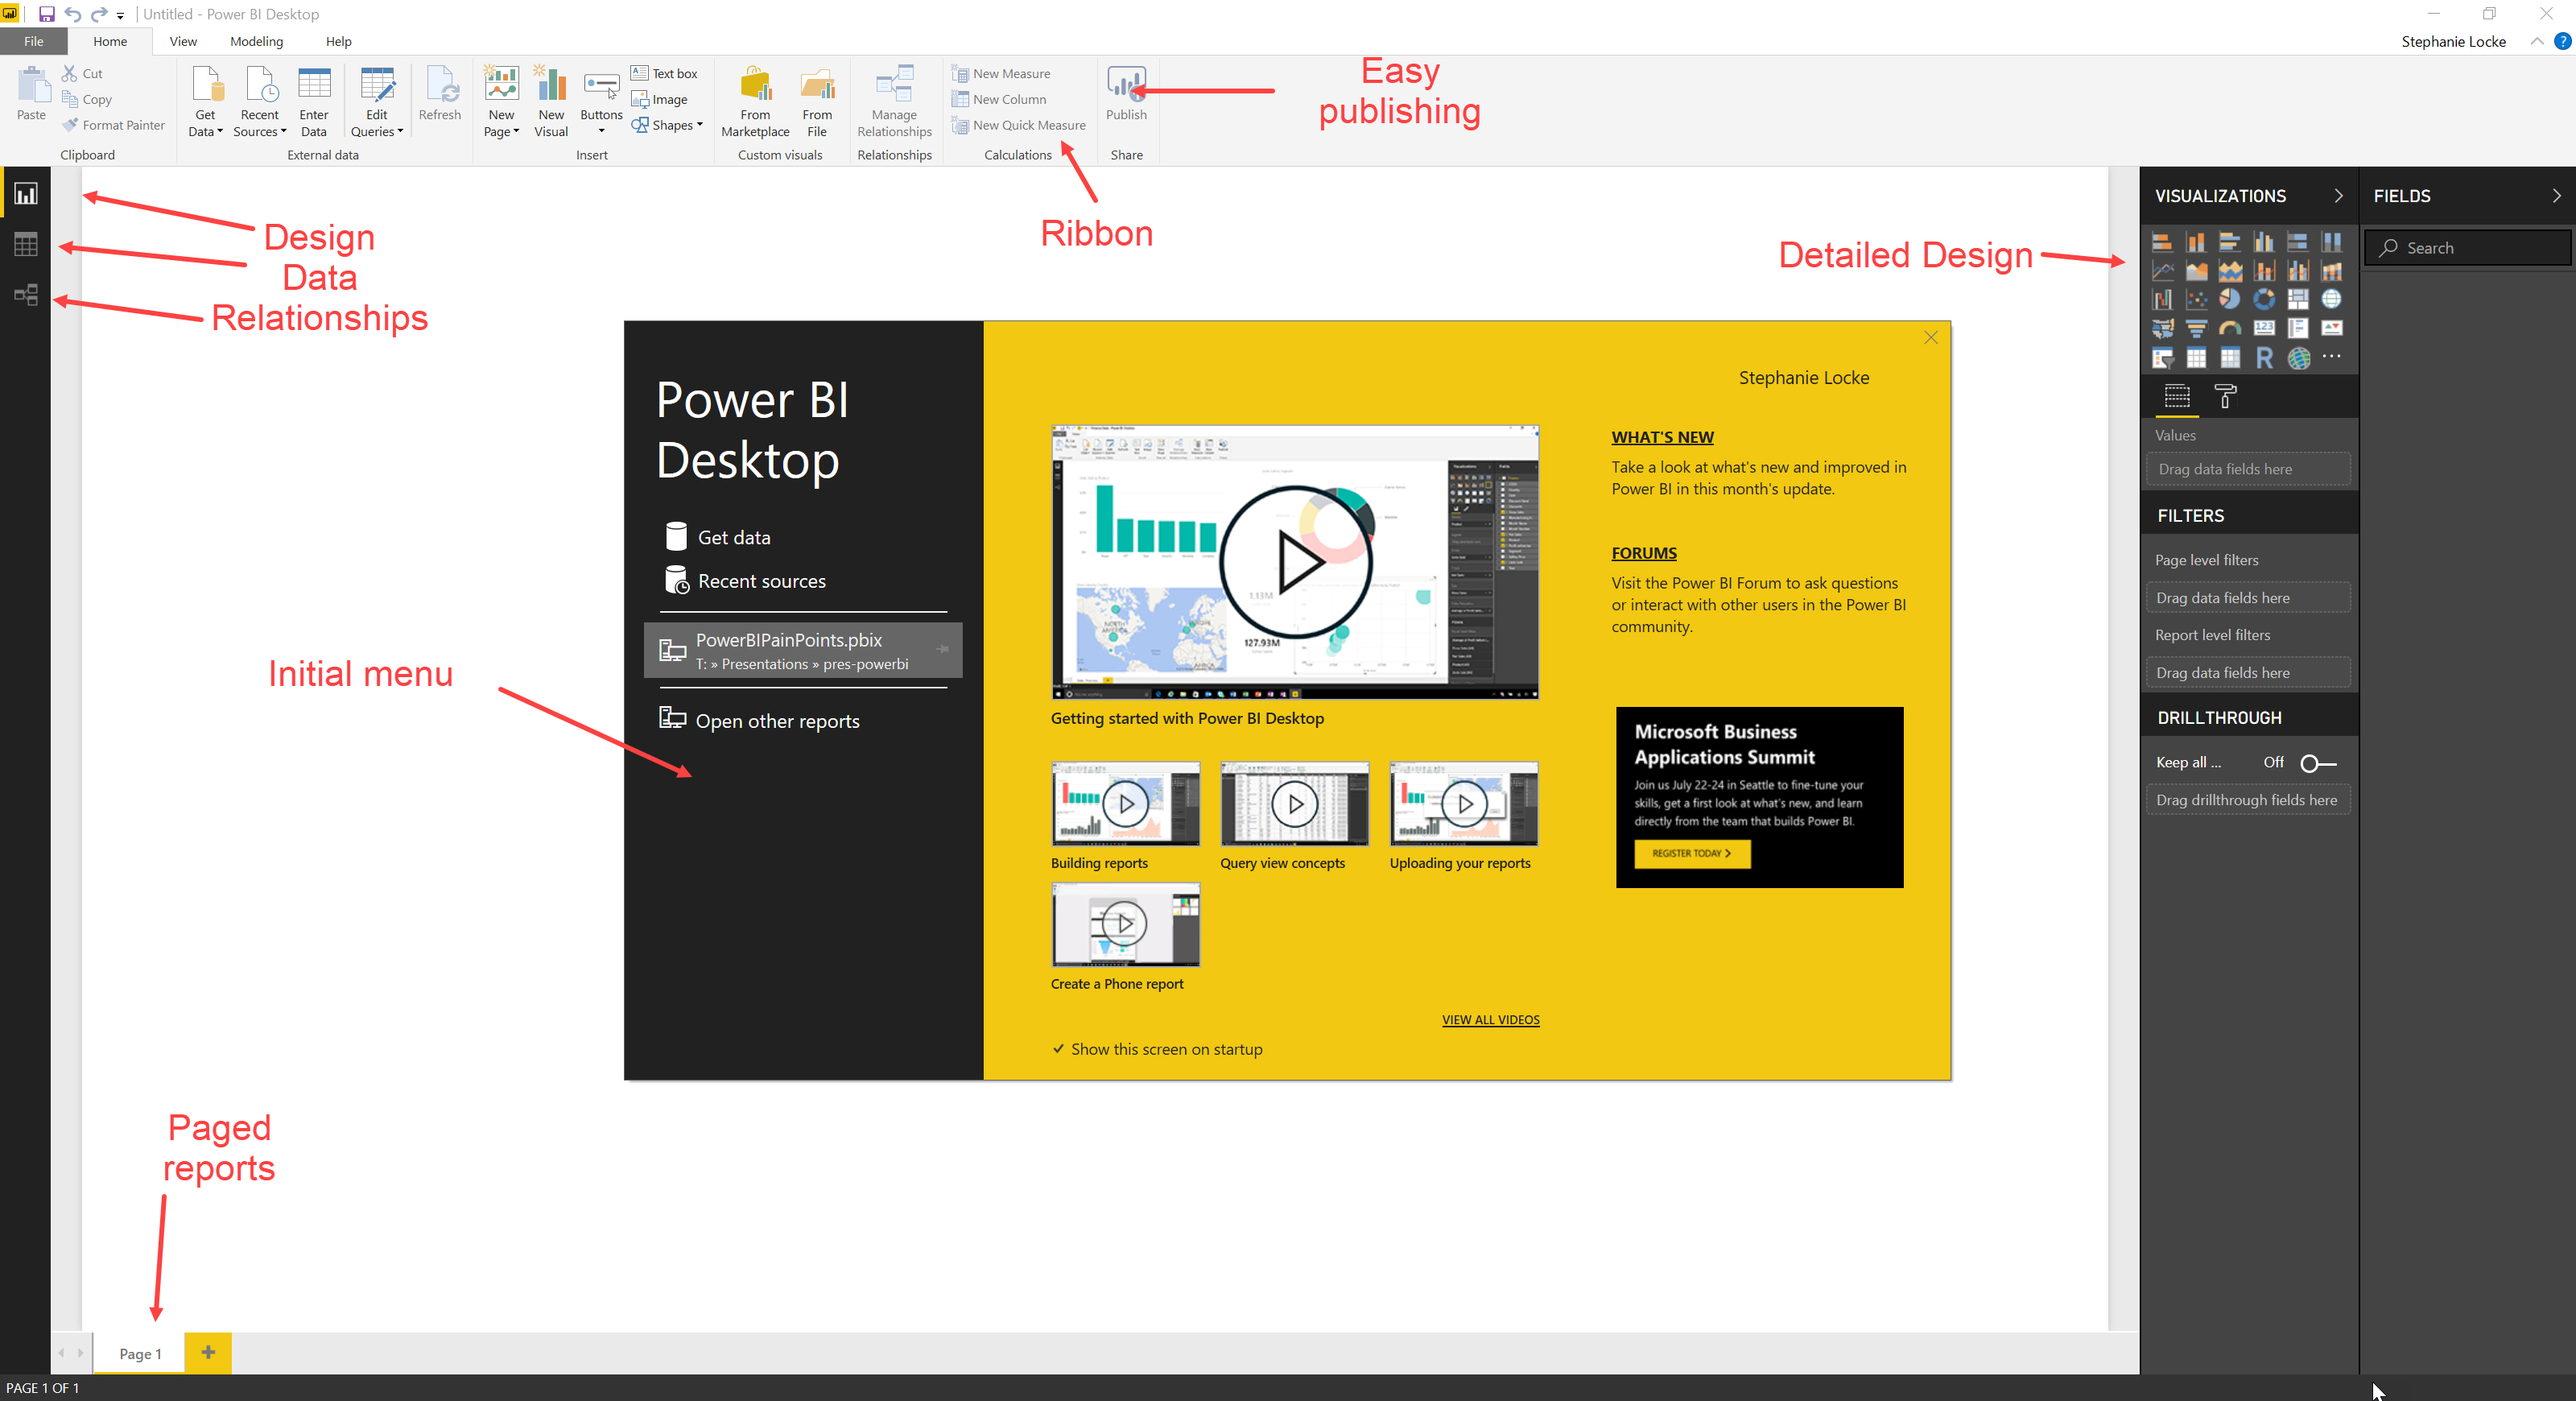
There’s also the desktop app (Windows only) that has traditionally had more functionality than the online version.
Let’s take a look around Power BI online:

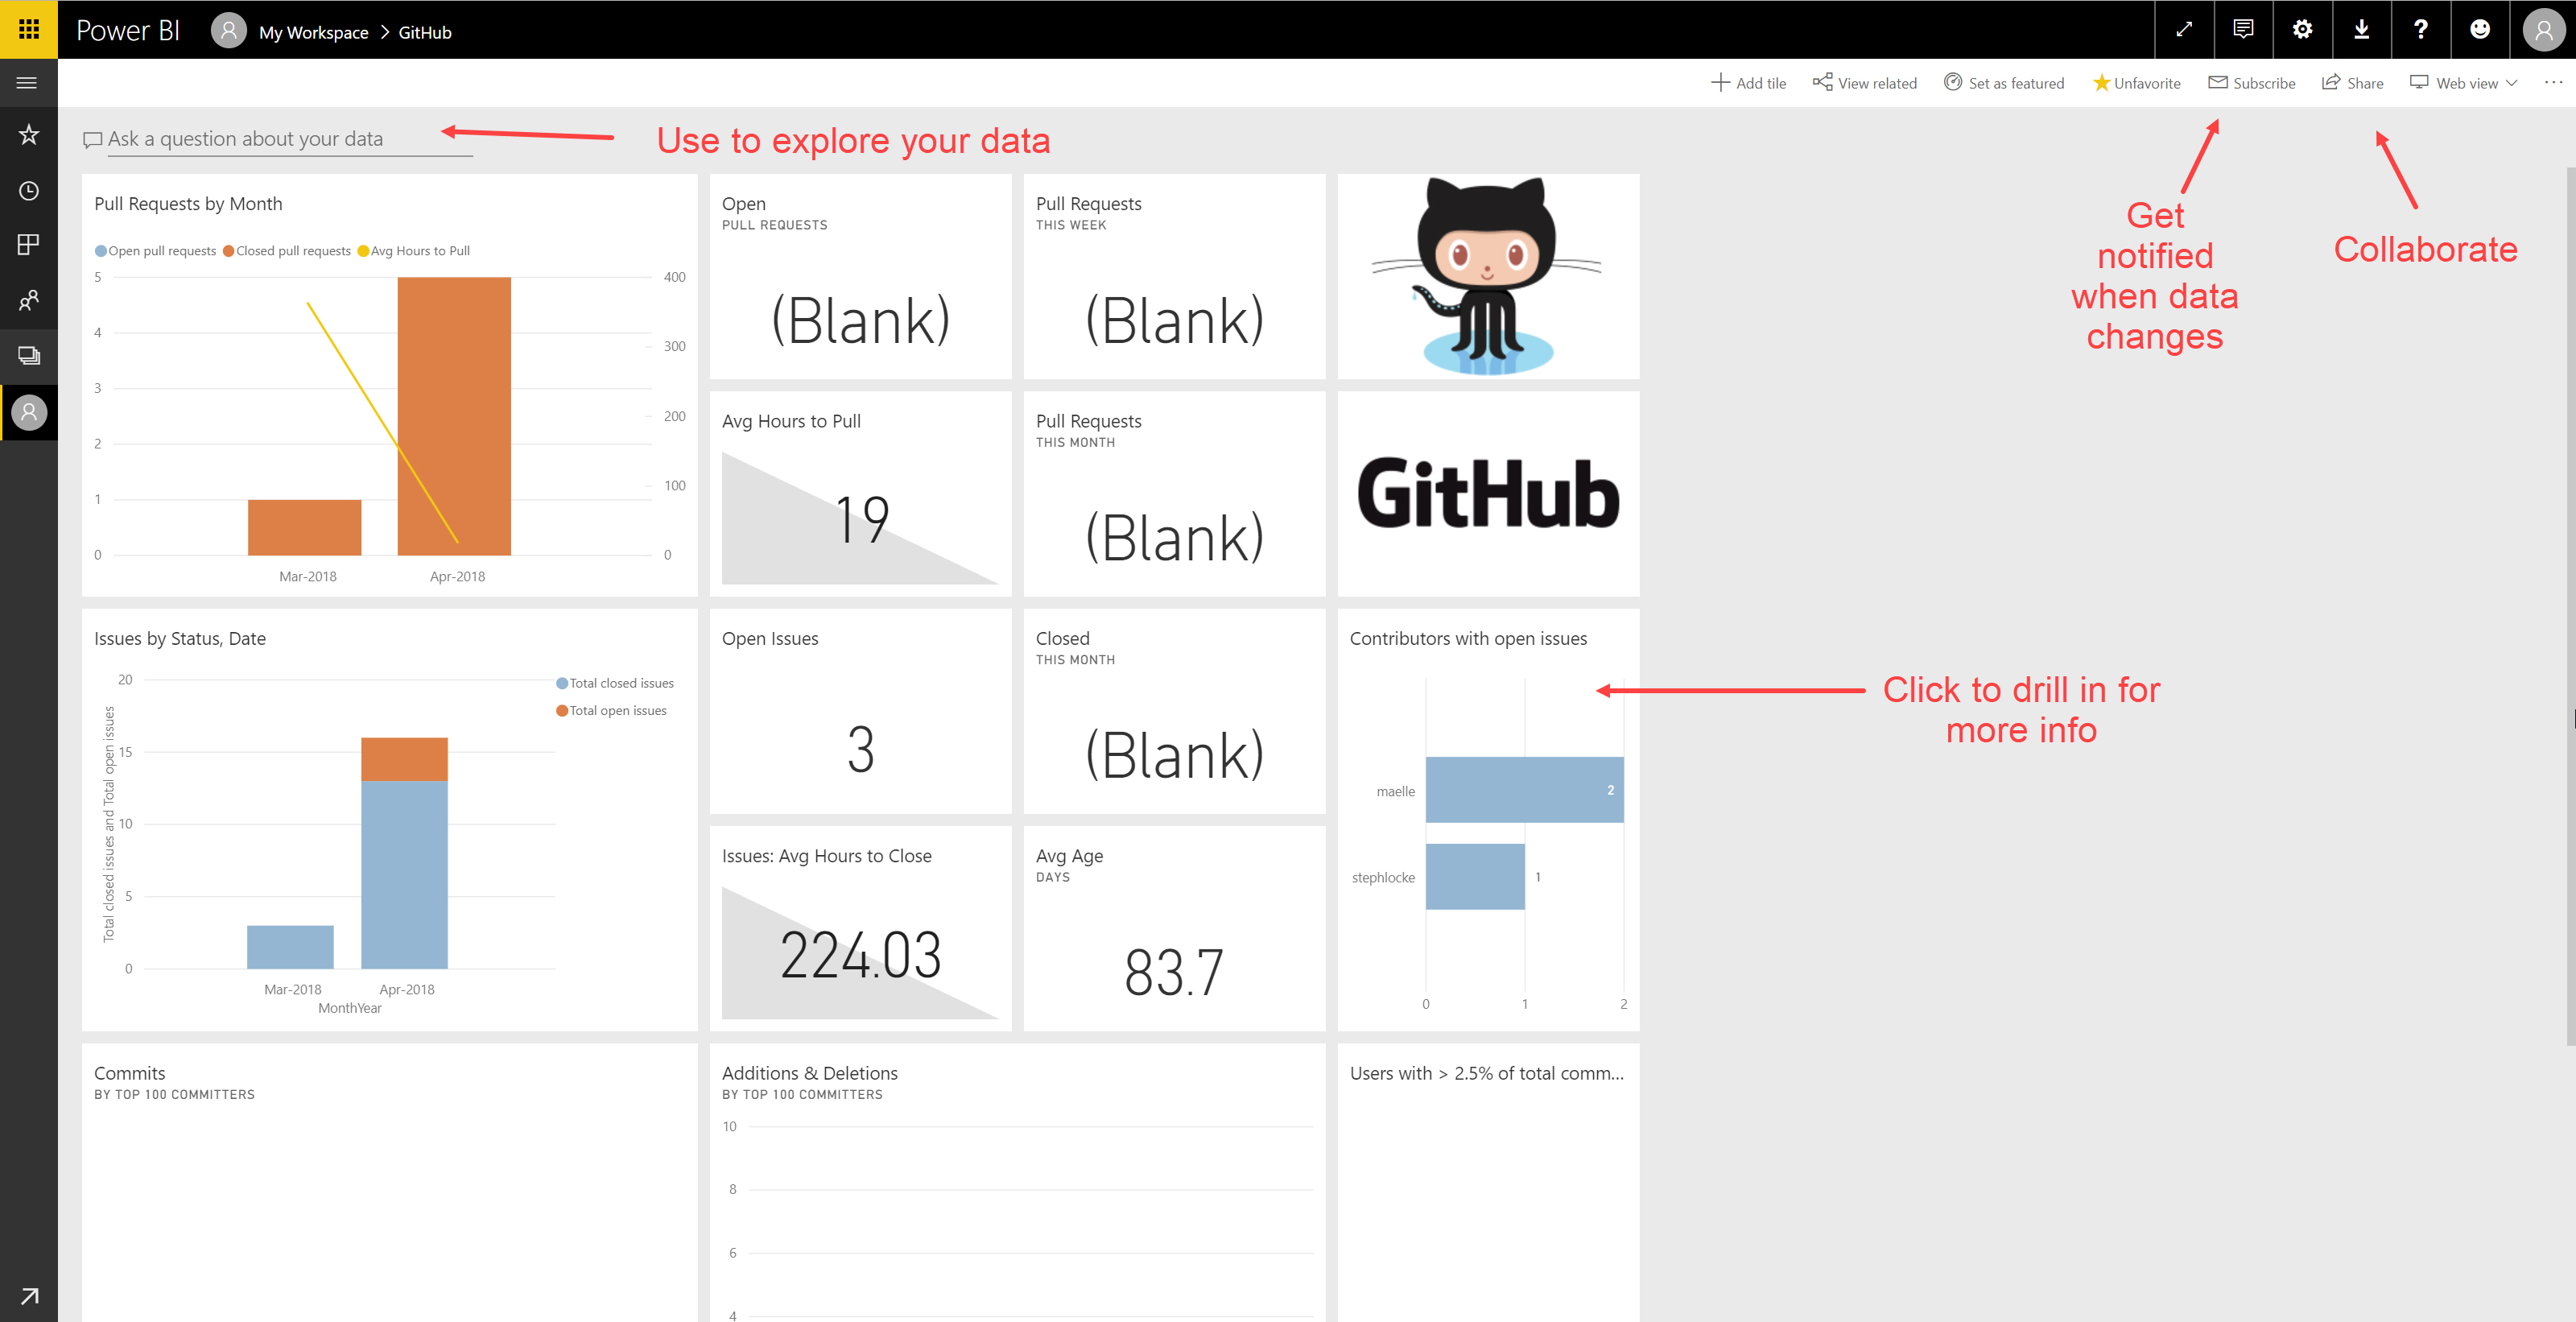
Once we click on a dashboard, we can start seeing more:

At the time of writing, we can only connect to clean data in Power BI online because we can’t edit the data online, just build dashboards. So when your data isn’t “ready to go”, you need to open the Power BI app:

Demos
Using Power BI online
- Logging into Power BI online
- Connecting to a service
- Exploring the dashboard
- Asking questions
- Viewing the underlying reports
Using Power BI desktop
- Load some data
- Produce a basic visualisation
Exercises
- Install Power BI app from the Windows store
- Register for Power BI
- See if there’s an online platform you use normally that you can connect to with Power BI online
- Work through the connection process
- Explore the results