Data Manipulation
We’ve briefly touched on this already, but in this section we’ll take a deeper look at Data Manipulation. When we get data into Power BI it may well not be ideal for working with; it may be ideally structured for storage, but not for reporting, or we may have difficulty matching up certain values due to data formatting. Data maipulation is the step in which we’ll set all this right, and make sure that our data works the way we need it to.
Transformations
Firstly, we’ll need to make transformation to the way the data is structured, and the format it’s in
Commonly used options
- First row as headers (often the data we bring in doesn’t differentate between headers and data)
- Sorting out data types (data types may be incorrectly applied, or missing entirely)
- Tidying text data (text is often messy, we may want to capitalise name, or remove excess spaces)
- Remove Rows to deduplicate data (if we’re combining data sets, we may end up with duplicate data)
- Summarisable
- NA replacement (when there is no value in a record, it will often return NA instead of 0)
- Split column (sometimes a column may contain multiple attributes, such as “City-Country”)
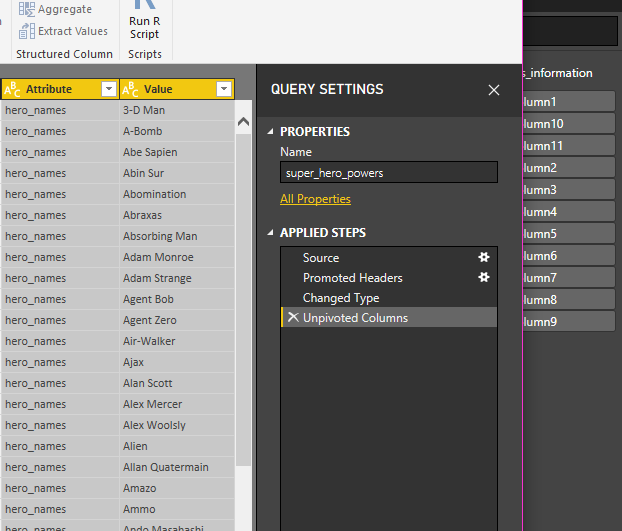
- Reshaping data (we talked previously about the different shapes imported data can take)
- Pivot (take wide data with lots of columns and make it into narrow data with lots of rows)
- Unpivot (take narrow data with lots of rows and make it into wide data with lots of columns)
Undoing changes
Changes can be made in error, or might simply need to be reversed. It’s important to be able to do this easily and reliably. The simplest method of undoing changes is of course the undo function (Ctrl+Z on a PC.) This only works for changes you’ve only just made however. To be able to ensure that we can always reverse changes we need to make sure we that retain a record of what the data used to look like.
OK, we’re not making changes to the data source here, and we don’t need to worry about backups and the like. As a result we can just revert our data connection. If we do this though, we lose all the changes we made. PowerBI keeps a full history of the changes we make, so we can revert back anything we do; if we change a bunch of data types and then picot our data, we can undo the changes to the data types without losing the changes to data structure!
Best practices
The best performing code is code you never have to run - what can we do to filter before the data gets loaded into Power BI? Can we add filters to the source that reduce the data we need to load and process? While it might be quicker to do our changes and calulation on the Power BI end, it’s usually better to do them at source.
Demos
Import some data and use some of the transformations. Make sure to roll some back.
Calculated columns and measures
Calculated columns are extra values added to our data set. We use these when we need extract data from other columns for grouping, or for making joins. We use measures when we want to perform calculations like sum of sales or count of customers.
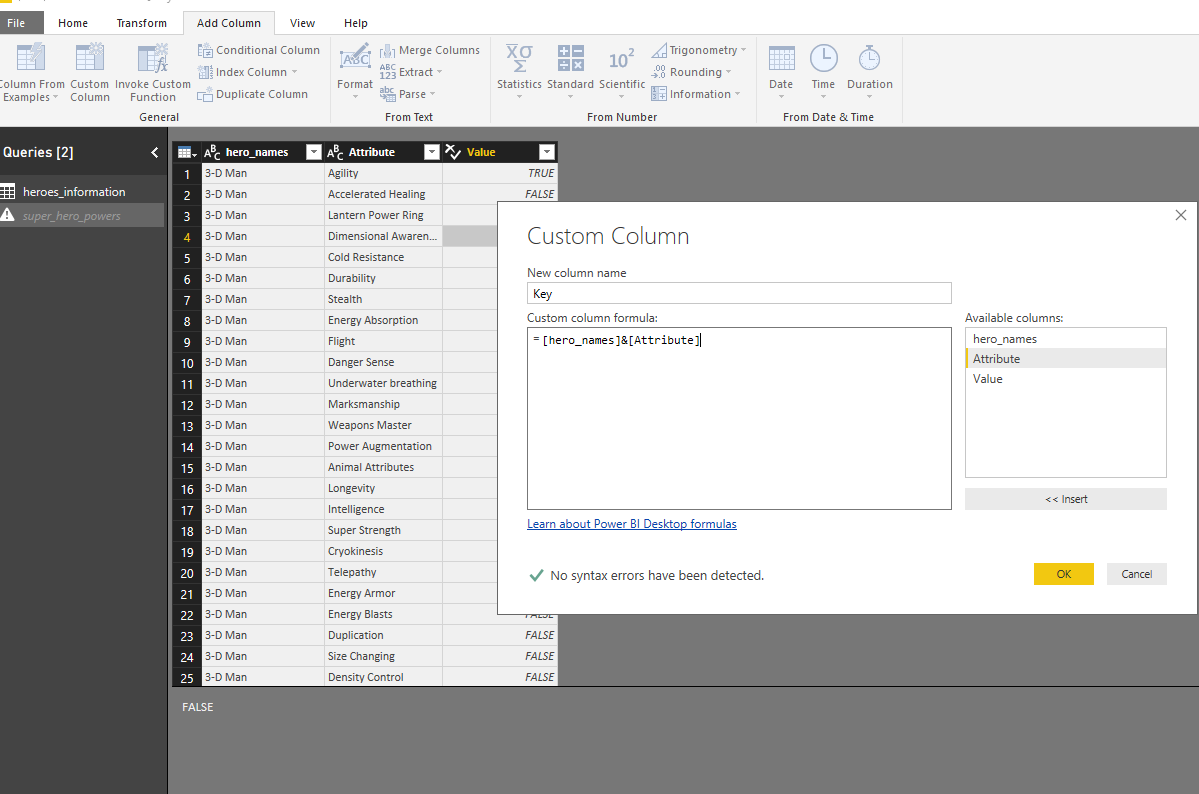
Within our data model view we can add measures and calculated columns from the Add Columns tab. Choose the type of column to add, and PowerBI will provide a window for creating our formula, which will then be added to the end of the currently displayed table.
Demos
- Create a calculated column that returns the first name of a superhero
- Create a measure that returns the average ratio of height and weight
Demos
- Revisit the formulae written in previous demo
- Show the intellisense and DAX Studio for extra help
Exercises
- Make sure columns that count as measures are handled as such
- Tidy up formatting and column names
- Look up the formula for BMI and add BMI as a calculated column
- Create a high, medium, low BMI category column
Recommended resources and readings
- Marco Russo and Alberto Ferrari